Home > Science > Space Exploration > Planets > Earth
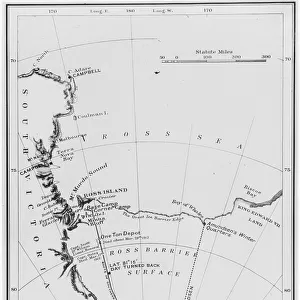
Water vapour maps of Antarctica, 2004

![]()
Wall Art and Photo Gifts from Science Photo Library
Water vapour maps of Antarctica, 2004
Water vapour maps of Antarctica. Satellite images of the increase in water vapour over Antarctica from 13 August to 14 October 2004 (the austral spring). The sequence starts at upper left, and runs from right-to-left and top-to-bottom, ending at lower right. The relative amount of water vapour varies from low (green) through yellow to high (red). This increase in water vapour accompanies the formation of the ozone hole. The data was obtained by the Microwave Limb Sounder (MLS) instrument on NASAs AURA satellite
Science Photo Library features Science and Medical images including photos and illustrations
Media ID 6373331
© NASA/SCIENCE PHOTO LIBRARY
2004 Antarctic Antarctica Atmosphere Atmospheric Science Aura Cfcs Change Climate Change Climatological Climatology Earth Observation Earth Science From Space Gases Greenhouse Gas Increase Increasing Montage Ozone Depletion Ozone Hole Ozone Layer Region Satellite Satellite Image Sciences Seasonal Spring Water Vapour
FEATURES IN THESE COLLECTIONS
> Animals
> Mammals
> Muridae
> Water Mouse
> Maps and Charts
> Related Images
> Science
> Space Exploration
> Planets
> Earth
> Science
> Space Exploration
> Related Images
> Science
> Space Exploration
> Satellite Imagery
EDITORS COMMENTS
This print showcases water vapor maps of Antarctica captured in 2004. The satellite images depict the remarkable increase in water vapor over the region during the austral spring, spanning from 13 August to 14 October. The sequence commences at the upper left corner and proceeds from right-to-left and top-to-bottom until reaching the lower right corner. The varying shades on the map represent different levels of relative water vapor content, ranging from low (green) to high (red). This surge in water vapor coincides with the formation of the ozone hole, highlighting its correlation with atmospheric changes. The data used for this visualization was collected by NASA's AURA satellite through its Microwave Limb Sounder (MLS) instrument. By capturing these intricate details, scientists gain valuable insights into climatological patterns and Earth's ever-evolving atmosphere. This image serves as a testament to our growing understanding of climate change and its impact on our planet. It underscores how advancements in earth science and observation have allowed us to study phenomena like ozone depletion, greenhouse gases, and seasonal variations more comprehensively. Science Photo Library presents this thought-provoking montage that encapsulates both scientific significance and aesthetic appeal. It stands as a reminder of humanity's ongoing efforts to comprehend Earth's complex systems while emphasizing their importance for future generations' well-being.
MADE IN THE USA
Safe Shipping with 30 Day Money Back Guarantee
FREE PERSONALISATION*
We are proud to offer a range of customisation features including Personalised Captions, Color Filters and Picture Zoom Tools
SECURE PAYMENTS
We happily accept a wide range of payment options so you can pay for the things you need in the way that is most convenient for you
* Options may vary by product and licensing agreement. Zoomed Pictures can be adjusted in the Cart.